Singularity Functions#
Continous Domain#
Unit Step Function#
The unit step function \( u(t) \) is defined as:
This function is used to represent a signal that turns on at \( t = 0 \).
Unit Impulse Function#
The unit impulse function \( \delta(t) \) is defined as the derivative of the unit step function:
It has the sifting property:
And for any continuous function \( f(t) \):
Unit Ramp Function#
The unit ramp function \( r(t) \) is defined as the integral of the unit step function:
Physical Step Function#
The physical step function is a more realistic version of the unit step function, representing a gradual transition rather than an instantaneous jump. It can be modeled using the sigmoid function:
where \( \alpha \) determines the steepness of the transition.
Derivative Relations#
Unit impulse function is the derivative of the unit step function:
Unit step function is the derivative of the unit ramp function:
Properties of the Impulse Function#
Sifting Property: $\( \int_{-\infty}^{\infty} f(t) \delta(t - t_0) \, dt = f(t_0) \)$
Scaling Property: $\( \delta(at) = \frac{1}{|a|} \delta(t) \)$
Shifting Property: $\( \delta(t - t_0) \)$
Derivative of the unit step function
Integral of the Impulse Function: $\( \int_{-\infty}^{t} \delta(\tau) \, d\tau = u(t) \)$
→ The impulse function is defined by its properties rather than by its values
Summary Table#
Function |
Definition |
Relation |
|---|---|---|
Unit Step Function |
\( u(t) = \begin{cases} 0 & t < 0 \\ 1 & t \geq 0 \end{cases} \) |
\( u(t) = \frac{d}{dt} r(t) \) |
Unit Impulse Function |
\( \delta(t) = \frac{d}{dt} u(t) \) |
- |
Unit Ramp Function |
\( r(t) = \begin{cases} 0 & t < 0 \\ t & t \geq 0 \end{cases} \) |
\( r(t) = \int_{-\infty}^{t} u(\tau) \, d\tau \) |
Physical Step Function |
\( \text{sigmoid}(t) = \frac{1}{1 + e^{-\alpha t}} \) |
- |
Python code#
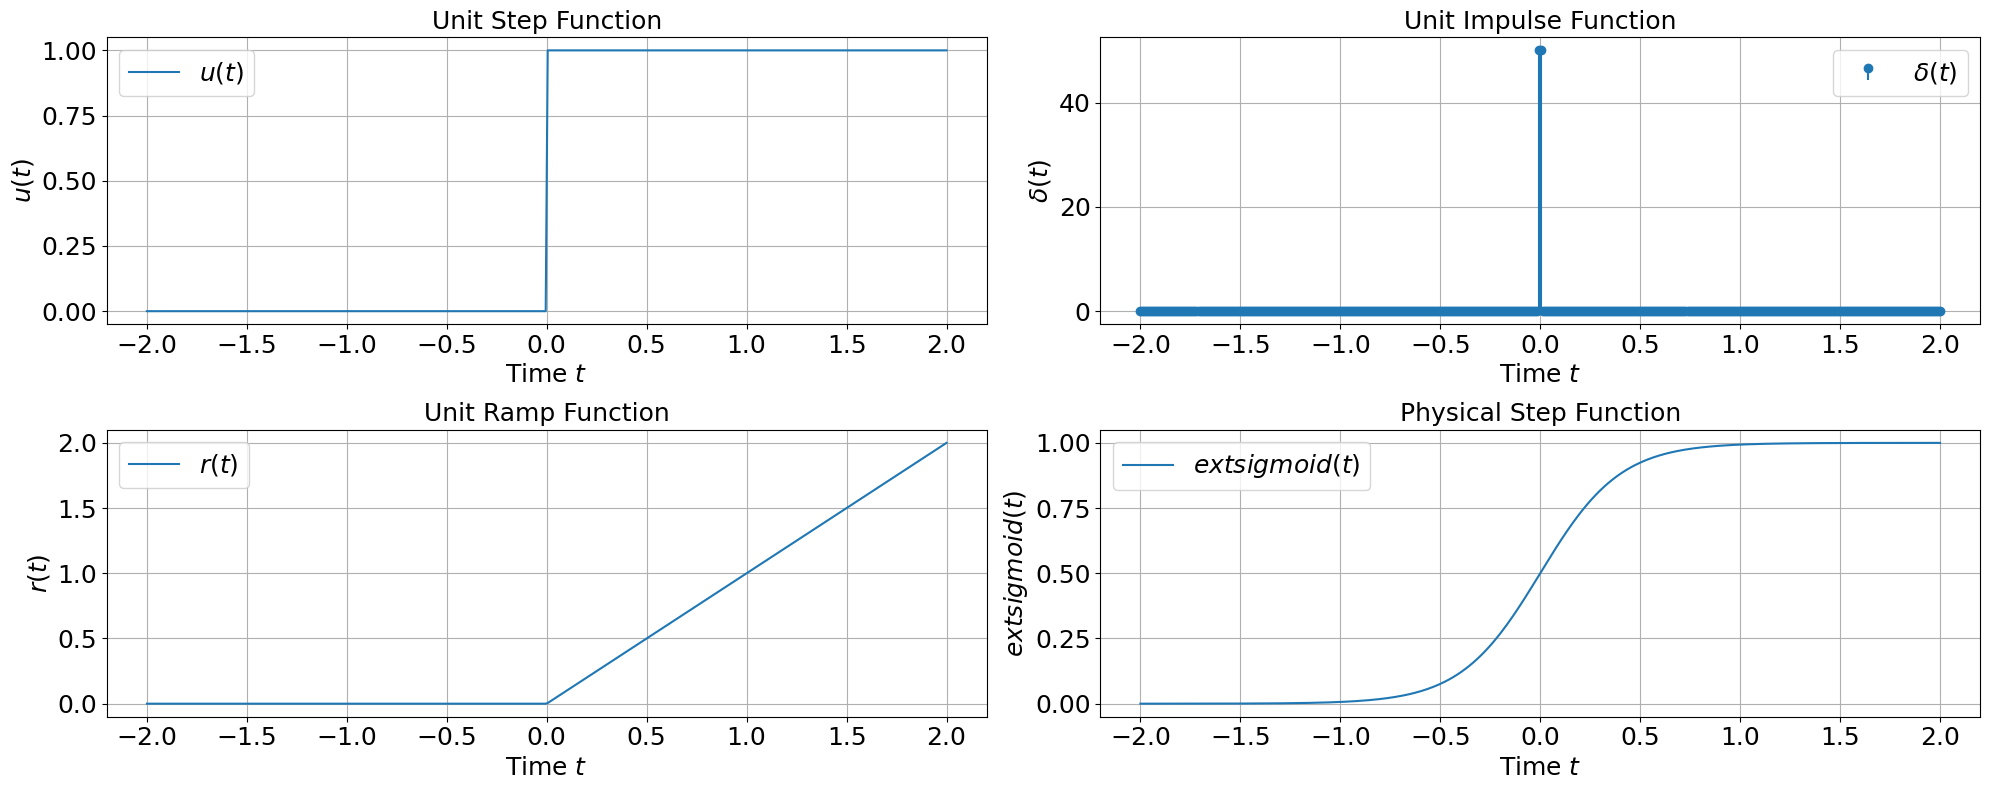
This Python code generates plots for the unit step function, unit impulse function (approximated), unit ramp function, and physical step function (sigmoid). Each plot illustrates the respective function over time.
import numpy as np
import matplotlib.pyplot as plt

# Time array
t = np.linspace(-2, 2, 400)

# Unit step function
u = np.heaviside(t, 1)

# Unit impulse function approximation
delta = np.zeros_like(t)
delta[np.abs(t) < 0.01] = 1 / 0.02

# Unit ramp function
r = np.maximum(0, t)

# Physical step function (sigmoid)
alpha = 5
sigmoid = 1 / (1 + np.exp(-alpha * t))

# Plotting
fig, axs = plt.subplots(2, 2, figsize=(20, 8))

# Font size
fontsize = 18

# Plot unit step function
axs[0, 0].plot(t, u, label='$u(t)$')
axs[0, 0].set_title('Unit Step Function', fontsize=fontsize)
axs[0, 0].set_xlabel('Time $t$', fontsize=fontsize)
axs[0, 0].set_ylabel('$u(t)$', fontsize=fontsize)
axs[0, 0].legend(fontsize=fontsize)
axs[0, 0].tick_params(axis='both', which='major', labelsize=fontsize)
axs[0, 0].grid(True)

# Plot unit impulse function
axs[0, 1].stem(t, delta, label='$\\delta(t)$', basefmt=" ")
axs[0, 1].set_title('Unit Impulse Function', fontsize=fontsize)
axs[0, 1].set_xlabel('Time $t$', fontsize=fontsize)
axs[0, 1].set_ylabel('$\\delta(t)$', fontsize=fontsize)
axs[0, 1].legend(fontsize=fontsize)
axs[0, 1].tick_params(axis='both', which='major', labelsize=fontsize)
axs[0, 1].grid(True)

# Plot unit ramp function
axs[1, 0].plot(t, r, label='$r(t)$')
axs[1, 0].set_title('Unit Ramp Function', fontsize=fontsize)
axs[1, 0].set_xlabel('Time $t$', fontsize=fontsize)
axs[1, 0].set_ylabel('$r(t)$', fontsize=fontsize)
axs[1, 0].legend(fontsize=fontsize)
axs[1, 0].tick_params(axis='both', which='major', labelsize=fontsize)
axs[1, 0].grid(True)

# Plot physical step function (sigmoid)
axs[1, 1].plot(t, sigmoid, label='$\text{sigmoid}(t)$')
axs[1, 1].set_title('Physical Step Function', fontsize=fontsize)
axs[1, 1].set_xlabel('Time $t$', fontsize=fontsize)
axs[1, 1].set_ylabel('$\text{sigmoid}(t)$', fontsize=fontsize)
axs[1, 1].legend(fontsize=fontsize)
axs[1, 1].tick_params(axis='both', which='major', labelsize=fontsize)
axs[1, 1].grid(True)

plt.tight_layout()
plt.show()

Discrete Domain#
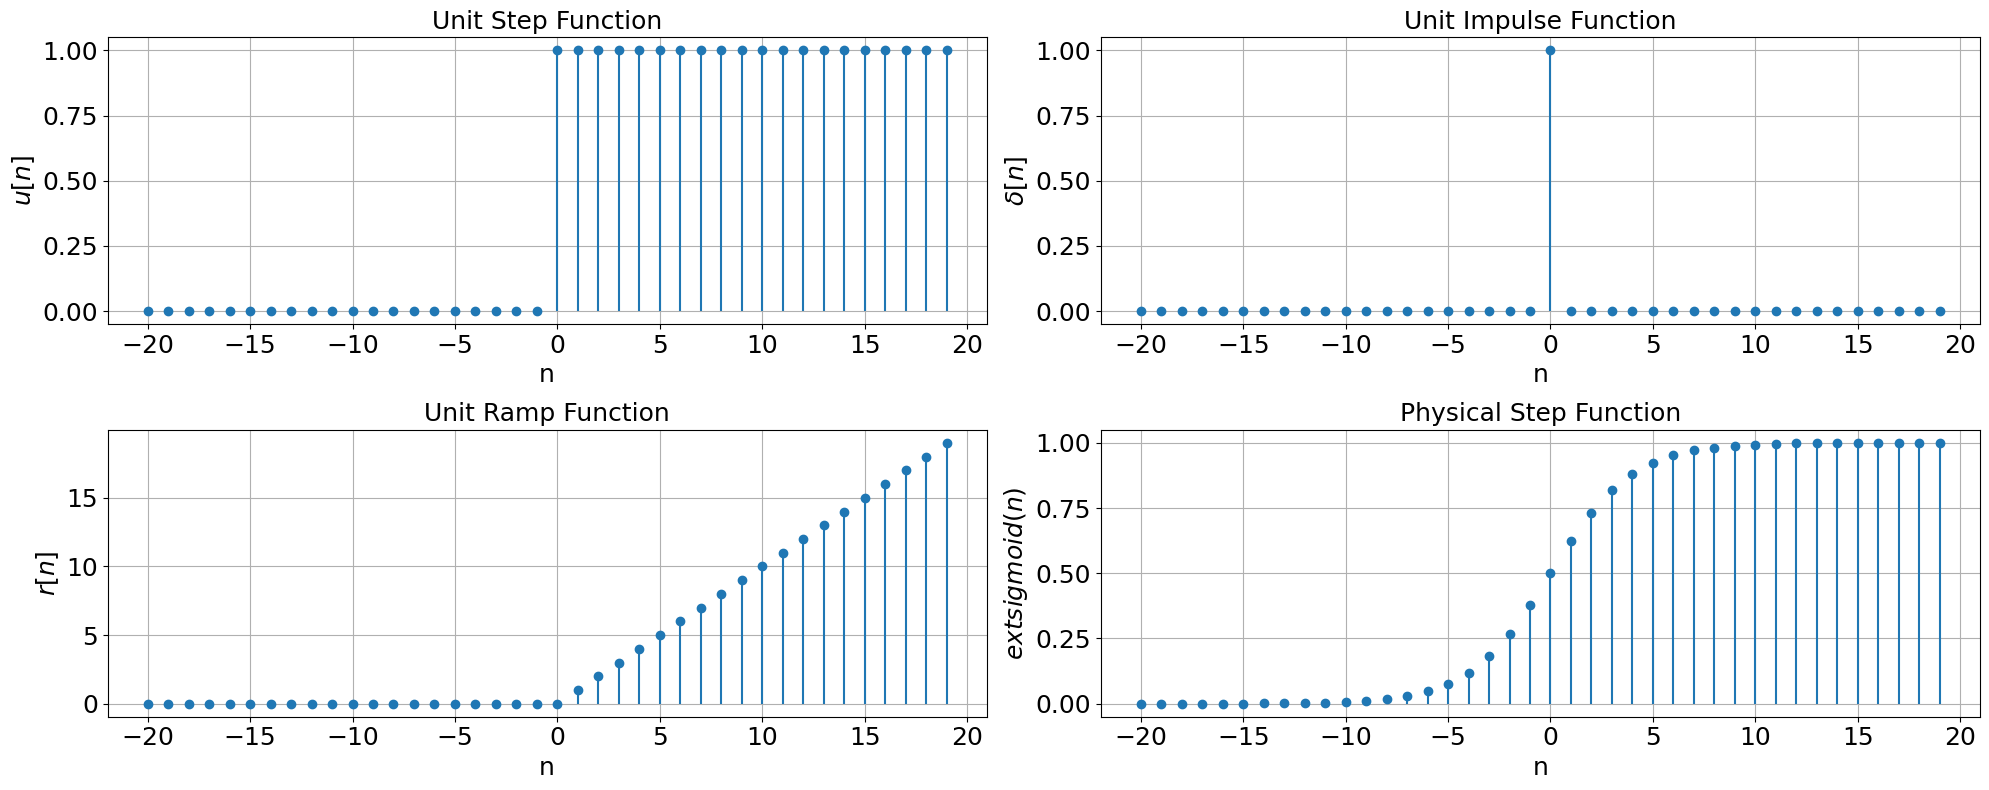
Singularity functions in the discrete domain are analogous to those in the continuous domain but are defined for discrete-time signals. Here, we will explore the unit step function, unit impulse function, unit ramp function, and physical step function in the discrete domain. We will also illustrate these functions using Python.
Unit Step Function#
The unit step function \( u[n] \) is defined as:
This function is used to represent a signal that turns on at \( n = 0 \).
Unit Impulse Function#
The unit impulse function \( \delta[n] \) is defined as the difference between \( u[n] \) and \( u[n-1] \):
It has the sifting property:
And for any discrete function \( f[n] \):
Unit Ramp Function#
The unit ramp function \( r[n] \) is defined as the sum of the unit step function:
Physical Step Function#
The physical step function in the discrete domain is a more realistic version of the unit step function, representing a gradual transition rather than an instantaneous jump. It can be modeled using the sigmoid function:
where \( \alpha \) determines the steepness of the transition.
import numpy as np
import matplotlib.pyplot as plt

# Discrete time variable
n = np.arange(-20, 20)

# Unit step function
u = np.heaviside(n, 1)

# Unit impulse function
delta = np.zeros_like(n)
delta[n == 0] = 1

# Unit ramp function
r = np.maximum(0, n)

# Physical step function (sigmoid)
alpha = 0.5
sigmoid = 1 / (1 + np.exp(-alpha * n))

# Plotting
fig, axs = plt.subplots(2, 2, figsize=(20, 8))

# Font size
fontsize = 18

# Plot unit step function
axs[0, 0].stem(n, u, basefmt=" ")
axs[0, 0].set_title('Unit Step Function', fontsize=fontsize)
axs[0, 0].set_xlabel('n', fontsize=fontsize)
axs[0, 0].set_ylabel('$u[n]$', fontsize=fontsize)
axs[0, 0].tick_params(axis='both', which='major', labelsize=fontsize)
axs[0, 0].grid(True)

# Plot unit impulse function
axs[0, 1].stem(n, delta, basefmt=" ")
axs[0, 1].set_title('Unit Impulse Function', fontsize=fontsize)
axs[0, 1].set_xlabel('n', fontsize=fontsize)
axs[0, 1].set_ylabel('$\\delta[n]$', fontsize=fontsize)
axs[0, 1].tick_params(axis='both', which='major', labelsize=fontsize)
axs[0, 1].grid(True)

# Plot unit ramp function
axs[1, 0].stem(n, r, basefmt=" ")
axs[1, 0].set_title('Unit Ramp Function', fontsize=fontsize)
axs[1, 0].set_xlabel('n', fontsize=fontsize)
axs[1, 0].set_ylabel('$r[n]$', fontsize=fontsize)
axs[1, 0].tick_params(axis='both', which='major', labelsize=fontsize)
axs[1, 0].grid(True)

# Plot physical step function (sigmoid)
axs[1, 1].stem(n, sigmoid, basefmt=" ")
axs[1, 1].set_title('Physical Step Function', fontsize=fontsize)
axs[1, 1].set_xlabel('n', fontsize=fontsize)
axs[1, 1].set_ylabel('$\text{sigmoid}(n)$', fontsize=fontsize)
axs[1, 1].tick_params(axis='both', which='major', labelsize=fontsize)
axs[1, 1].grid(True)

plt.tight_layout()
plt.show()

Summary Table#
Function |
Definition |
Relation |
|---|---|---|
Unit Step Function |
\( u[n] = \begin{cases} 0 & n < 0 \\ 1 & n \geq 0 \end{cases} \) |
\( u[n] = \sum_{k=-\infty}^{n} \delta[k] \) |
Unit Impulse Function |
\( \delta[n] = \begin{cases} 1 & n = 0 \\ 0 & \text{otherwise} \end{cases} \) |
- |
Unit Ramp Function |
\( r[n] = \begin{cases} 0 & n < 0 \\ n & n \geq 0 \end{cases} \) |
\( r[n] = \sum_{k=0}^{n} u[k] \) |
Physical Step Function |
\( \text{sigmoid}(n) = \frac{1}{1 + e^{-\alpha n}} \) |
- |
